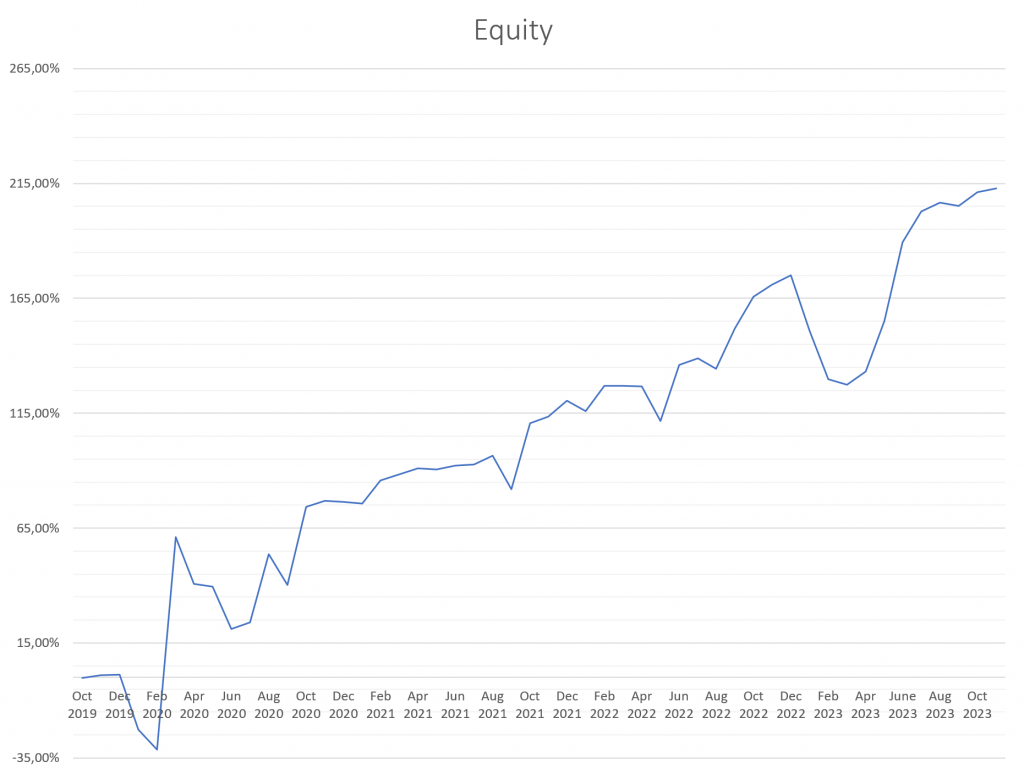
INVESTMENT STRATEGY (core)
Natural Gas Derivatives Program
The Natural Gas Derivatives Program is a systematic commodity strategy designed to capitalize on inefficiencies in the global natural gas futures markets. By identifying statistical mispricings along the forward curve, the program employs a blend of statistical arbitrage and directional market exposure through sophisticated options strategies.
Our trading signals are primarily driven by supply and demand imbalances influenced by seasonality, weather patterns, implied storage costs, unique events (e.g., price shocks), and changes in convenience yields. Historically, the returns of this program have shown low correlation with other investments, including niche energy-focused CTAs.
The strategy typically involves multiple spread positions within the market, each executed as an intra-market calendar spread. Additional spreads may be utilized to hedge existing positions or mitigate exposure to unfavorable forward curve movements.
The average trade length for the program is approximately 30 days, with holding periods ranging from 1 to 20 days. Our investment process is governed by strict risk management protocols, including dynamic position sizing to maintain targeted return volatility of 20% per year.
This near market-neutral spread trading program is expertly crafted to exploit shifts in the forward curve of energy markets, delivering consistent performance through meticulous strategy and risk management.
Statistics
| Suggested Minimum Cap | $500,000 |
| What it trades | Futures/Spreads |
| % Profitable | 67% |
| Avg trade duration | 2 weeks |
| Max peak-to-valley drawdown | -40.93% |
| Avg win | $9,647 |
| Avg loss | $13,918 |
Basic risks: The risk of loss in trading futures is substantial. Therefore, it is mandatory to carefully consider whether such trading is suitable in the light of interested investor’s financial conditions. A potential loss cannot be determined in advance and can exceed any collateral (margin) posted. In considering whether to trade or to authorize someone to trade, interested investors should be aware of all risk factors as described in Disclosure Document which is available upon request.


Strategy Characteristics
| Annual return | 36.77% |
| Annualized volatility | 36.19% |
| Max peak-to-valley drawdown | -40.93% |
| Sharpe ratio | 1.71 |
| Average margin to equity | 23% |
| Sortino Ratio | 1.67 |
| Calmar Ratio | 1.74 |
| Correlation to SP500 | 0.11190 |
- Strategy traded based on Hedge Fund risk profile as notionally funded accounts and used 200% leverage exposure. This doubled risks and returns on the strategy. In nominal value account performance, all values in strategy characteristics have to be divided by 2.
- *The results presented herein represent the Natural Gas Investment Strategy performance that segregated from the whole performance of the fund as a separate investment vehicle Finartel Capital AIFLNP Ltd from October 2019.
- **Strategy started public tracking for clients on Collective2 LLC is a member of the National Futures Association (NFA).
- In different periods total, AUM under strategy floated from 0.2 up to 10.0m USD
INVESTMENT STRATEGY (sattelite)
ENERGY STOCKS/ETF STRATEGY
Natural gas physical negative rolling yield collection strategy.
Strategy idea – maintaining writing uncovered options on ETF:UNG on both sides. On each options expiration date to collect options premium from Theta in winning trades.
Source of trading model Alpha – based on historical observations 85% of the time Natural gas futures term structure is under of contango effect. And it creates a negative rolling yield with an average level of decline of 24% per year. This negative yield is decreasing the value of ETF: UNG.
To describe the strategy in one sentence: Natural Gas futures contango monetization through proxy assets.
Exposure to natural gas will be traded through Stocks or ETF’s replicated natural gas prices. (or options on
| Suggested Minimum Cap | $20,000 | |
| What it trades | Options | |
| % Profitable | 79.20% | |
| Avg trade duration | 9 days | |
| Max peak-to-valley drawdown | 13.85% | |
| Avg win | $101.53 | |
| Avg loss | $101.80 |
The sequence of trading looks:
1). Pricing with the model fair value of nearest expiration Natural Gas futures.
2). Calculation of intra-month expected VAR levels with 95%
3). Selling options on quasi-assets ETF:UNG from the up/down priced quantiles levels through coefficients adjustments.
4). Waiting till weekly single stocks option the expiration.
NVESTMENT STRATEGY (sattelite)
Outright directional futures trading
LINEAR EXPOSURE THROUGH FUTURES TO NATURAL GAS PRICES. (LONG/SHORT MODEL)
Strategy idea – The underlying idea behind this model is forecasting prices [T+5] days from now. And when there is mispricing between the nearest expiration of Natural Gas futures and our forecasted “Fair” price we place the trade in direction of our forecast.
Positions are opened/closed 15 minutes before the exchange’s daily settlement with limit orders.
Strategy rejects the Efficient Market Hypothesis. I do not believe that returns follow strict random walks and that assets are perfectly priced at all times. Model’s approach to investing begins with a thorough examination of a variety of factors (Fundamental and Statistical price data) that may cause markets to move, followed by an investigation of all detected anomalies and unusual market patterns.
Exposure to natural gas will be traded through Stocks or ETF’s replicated natural gas prices. (or options on
| Suggested Minimum Cap | $100,000 | |
| What it trades | Futures | |
| % Profitable | 68.0% | |
| Avg trade duration | 5 days | |
| Max peak-to-valley drawdown | 45.85% | |
| Avg win | $2.3k | |
| Avg loss | $1.98k |
The sequence of trading looks:
*In one direction, 3 lots can be opened at once. This is the maximum position size. Not martingale. A systemic increase in the lot. It can be both in the direction and against.
| Piramiding | Yes |